Loadavg 255 and other CPU stories
Understanding CPU metrics is not an easy task. This article is a collection of notes - scenarios I’ve encountered, experments I’ve run, concepts I’ve had to learn. Not a linear guide, just pieces of a mental model.
load avg of 255, a case study
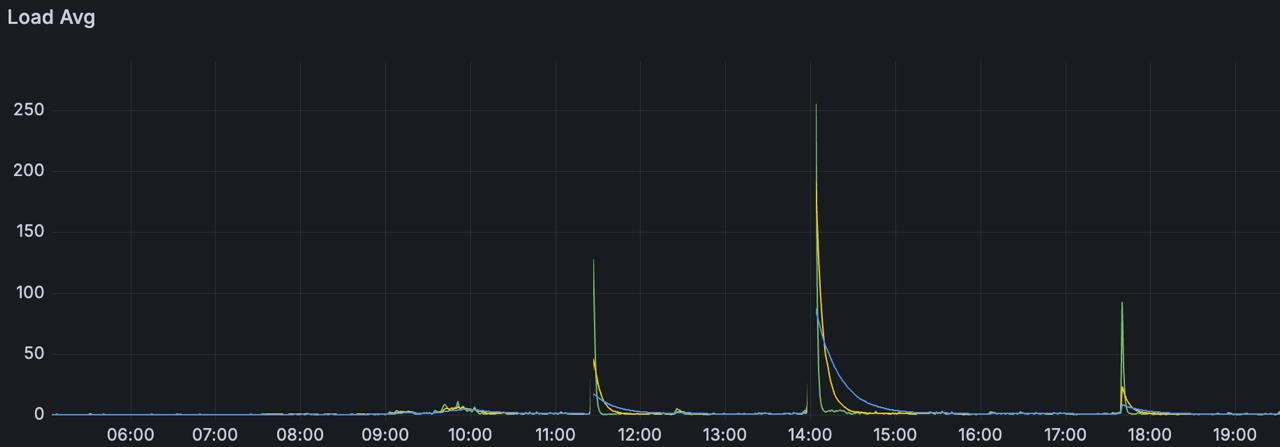
I worked with containers each running ~300 websockets. Whenever the container was restarted, the program would fetch a few data from a database, and try to reconnect to those websockets. In the first minute after the container restart, I would see a load avg of 255 processes. CPU utilization spiked to 100%, most of the processes were in the runqueue (you can check the runqueue with vmstat 1 - the r column).
After a few minutes, things would stabilize because processes would enter a blocked state waiting for network data - they were no longer demanding CPU, just waiting for I/O.
I didn’t have time to dig deeper - the spike lasted about a minute and the system stabilized. What I had was this Grafana graph and the knowledge that each container was reconnecting ~300 websockets on restart.
load average
A simple infinite loop to burn CPU:
int main() {
    volatile int i = 0;
    while(1) { i++; }
}
This is the load average of one of my machines right now. It’s only doing one thing: running our C program and another small process.
root@debian:~# cat /proc/loadavg
0.72 0.44 0.25 2/514 1358911
A few minutes later, I ran another process of the same C loop:
root@debian:~# cat /proc/loadavg
2.03 1.47 0.81 3/513 1359185
This machine has 12 cores. In the last minute, 2.03 processes were demanding CPU. In the last 5 minutes, 1.47 processes1. And in the last 15 minutes, 0.81. These are average loads based on a time slice. Since I have 12 cores, there’s more than enough room for the two processes to run in parallel, each one running on an arbitrary core.
root@debian:~# ps aux | grep spinc
root     1358887 99.9  0.0   2428  1244 pts/1    R    17:18  11:25 ./spinc
root     1359072 99.9  0.0   2428  1228 pts/1    R    17:23   6:47 ./spinc
root     1359303  0.0  0.0   6528  2316 pts/1    S+   17:29   0:00 grep spinc

root@debian:~# pidstat -p 1358887 1
05:31:29 PM   UID       PID    %usr %system  %guest   %wait    %CPU   CPU  Command
05:31:30 PM     0   1358887  100.00    0.00    0.00    0.00  100.00     0  spinc
^C

root@debian:~# pidstat -p 1359072 1
05:31:40 PM   UID       PID    %usr %system  %guest   %wait    %CPU   CPU  Command
05:31:41 PM     0   1359072  100.00    0.00    0.00    0.00  100.00    10  spinc
^C
The first procss is running on CPU 0, and the second on CPU 10. /proc/loadavg also shows us how many processes are in a running state (the machine has 513 processes, but only 3 in a running or runnable state). The last number is the PID of the last created process (our spinc process).
types of utilization
Processes can be IO-bound or processor-bound. IO-bound processes spends lots of time waiting for something to happen - a keyboard input, network I/O, etc. Processor-bound are types of processes that demands CPU time constantly. Our spinc example is processor-bound. It doesn’t touch I/O - it doesn’t call any system calls, so the process never enters kernel space. Remember our pidstat command? It showed 100% of utilization in the user space, and 0% in the kernel space.
Let’s test this. A program that writes the letter a to a file in a loop:
#include <unistd.h>
#include <fcntl.h>

int main() {
    int fd = open("/tmp/out.txt", O_WRONLY | O_CREAT | O_TRUNC, 0644);
    while(1) {
        write(fd, "a", 1);
    }
    return 0;
}
root@debian:~# pidstat -p $(pgrep writeloop) 1
06:56:14 PM   UID       PID    %usr %system  %guest   %wait    %CPU   CPU  Command
06:56:15 PM     0   1362410   11.00   88.00    0.00    0.00   99.00     0  writeloop
06:56:16 PM     0   1362410   15.00   85.00    0.00    0.00  100.00     0  writeloop
85-88% kernel space, 11-15% user space. The opposite of spinc. The program spends most of its time inside the kernel executing write(). The little time in user space is just the loop calling write again.
Here is what 3 seconds of execution looks like:
root@debian:~# strace -c ./writeloop
^@
^Cstrace: Process 1363710 detached
% time     seconds  usecs/call     calls    errors syscall
------ ----------- ----------- --------- --------- ----------------
100.00    1.355754           2    474265           write
Robert Love has a great insight about this:
The scheduling policy in a system must attempt to satisfy two conflicting goals: fast process response time (low latency) and maximal system utilization (high throughput). To satisfy these at-odds requirements, schedulers often employ complex algorithms to determine the most worthwhile process to run while not compromising fairness to other, lower priority processes. The scheduler policy in Unix systems tends to explicitly favor I/O-bound processes, thus providing good process response time. Linux, aiming to provide good interactive response and desktop performance, optmizes for process response (low latency), thus favoring I/O-bound processes over processor-bound processes.
a note on resource waste
Remember the websocket case? After stabilizing, most processes were blocked waiting for network data. They weren’t consuming CPU anymore, but they still existed in memory - heap, stack, code.
This is a design tradeoff. You can hold thousands of idle connections, but each one has a memory cost. The CPU doesn’t care about blocked processes, but your RAM does.
interrupts
A few weeks back I read this GitHub postmortem that I found amazing.
The setup: cadvisor doing thousands of syscalls per second reading cgroup stats, plus enormous amounts of network traffic hitting the machine.
The problem is: when a syscall returns to userspace, the kernel processes any pending softirqs first. Softirqs are deferred work - things like processing network packets (NET_RX), timers, tasklets. There’s a budget: 300 packets or 2ms, whichever comes first.
Each syscall return was an opportunity for the kernel to process softirqs. But cadvisor’s own work (TIMER, TASKLET) was consuming the budget before NET_RX could run. Packets accumulated in the NIC queue, waiting.
When the budget is exhausted, the kernel delegates remaining work to ksoftirqd - a normal kernel thread. The scheduler treats it like any other thread. It could take 100ms+ to run.
Result: packets waiting in hardware queue while ksoftirqd waited for CPU time. Latencies went from ~1ms to >100ms. A monitoring tool causing the very problem it was supposed to detect.
how the kernel handles this
Operating systems handle programs and processes. Processes are the artifact that runs on CPUs. But how does it handle this complex task? Multiple processes might wanna run right now, but only one can actually run on each physical core, right? The OS time shares processes. It creates rules and mechanisms to make concurrency possible. In “Linux Kernel Development”, Robert Love gives us an interesting take on multitasking:
“The timeslice, in effect, gives each runnable process a slice of the processor’s time. Managing the timeslice enables the scheduler to make global scheduling decisions for the system. It also prevents any one process from monopolizing the processor. On many modern operating systems, the timeslice is dynamically calculated as a function of process behavior and configurable system policy.”
Processes can have multiple states, but only running processes are actually making transistors switch. This is important, because processes may be sleeping, or blocked, or be in a runnable state - these exist in a static state. They consume memory (heap, stack, text, etc.), but they are not computed in CPU utilization.
If you want to go deeper into how the CPU actually works - the fetch-decode-execute cycle, pipeline stages, how instructions overlap - I recommend playing with the WebRISC-V simulator. Load a simple assembly program and watch it flow through the pipeline. Another good resource is cpu.land.
One thing to note: Linux load average includes processes in uninterruptible sleep (D state) - usually waiting for I/O. So high load doesn’t always mean CPU saturation. It could be slow disk, hung NFS, or storage issues. Check vmstat or iostat to distinguish. In addition, here the go-to guide of load average by Brendan Gregg: https://www.brendangregg.com/blog/2017-08-08/linux-load-averages.html ↩︎