Swapping under a tracing GC
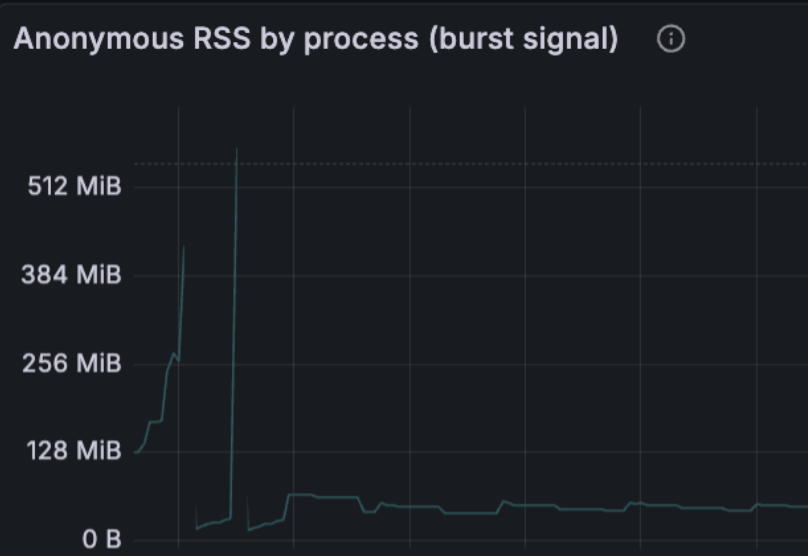
I’ve been thinking about adding swap to a workload. You see, this pod randomly spikes anonymous pages (by hundreds of MiB) and gets OOM killed. I wanted to fix that. So I thought about using memory.high from cgroup v2 and zram. Not a good idea, for this case.
The application is written in Go. The anonymous page spike comes from a path that does this: download a few things, call io.ReadAll, then proto.Unmarshal. We have two different types of bytes in the heap: a blob from io.ReadAll and then the blob translated into Go structs.
We know that Go’s allocator treats them both differently. Blobs don’t have pointers, so they are marked as noscan by the allocator - the compiler tells it which words are pointers. Structs do, so the collector does read them.
The span class is one byte with two things in it: the size class, shifted left, and one bit saying whether the objects hold pointers. That bit is what the collector checks before reading anything.
// runtime/mheap.go
func makeSpanClass(sizeclass uint8, noscan bool) spanClass {
	return spanClass(sizeclass<<1) | spanClass(bool2int(noscan))
}

func (sc spanClass) noscan() bool {
	return sc&1 != 0
}
It’s not half and half. I built 10k messages with the real generated types, marshalled then unmarshalled and I found out 176 bytes of encoded protobuf became 2340 bytes of heap. The struct graph is around 90% of the peak. Protobuf structs carry a slot for every field, so they cost much more heap than the []bytes from the blob.
Imagine you have the following: your application suddenly gets a spike in memory usage. The memory limit is reached. The kernel tries hard to reclaim memory inside that same cgroup. The reclaimed memory goes to zram or another swap backend. The process survives the spike at the cost of throttling - that’s what cgroup v2 does in this case - your process gets slower because the kernel is using it to reclaim memory. But it survives, and that’s what you want.
Ok. But now you have a problem: when memory got swapped, the kernel must somehow add a note in memory for the process, something like: “hey, if you need this particular memory address, let me know, it’s not here, but I know where it is and can fetch it for you”. This is called a swap entry. The page table entry has its present bit cleared (bit 0), and now the remaining bits hold something else: a swap type field, which says which swap device, and a swap offset field, which says which slot inside it.
You ask for data, the data is still in the address space of that process but not in physical memory, and the kernel knows where it is: this is a page fault. Now the kernel fetches the page, fixes the entry (because now the data is in memory), and runs the instruction again. The page fault can happen in two different ways with two different costs: the data is in RAM, but the mapping is missing - this is a minor page fault. In contrast, a major page fault is when the data had to be fetched from the swap area or from a file. Note this is about where it came from, not about disk: a fault served by zram, which only decompresses in RAM, still counts as major.
Now you probably remember the problem I was trying to solve: anonymous page burst, swap it. You also remember the application calls io.ReadAll and then Unmarshal, right? Now we have hundreds of mebibytes in swap, a bunch of them are… structs. With pointers. When memory pressure forces a swap, the GC needs to read it because those spans are marked as scan. When the collector reads them, what happens? That’s right. A page fault! In this case, a major one.
I measured this. I alloced 850 MiB of []byte in a 700 MiB container, forcing ~159 MiB out to file-backed swap. I built an index with one offset per 4 KiB and shuffled it, so every access was on a different page and the kernel’s readahead didn’t help. Then I walked it reading one byte per page, timing with time.Since and counting faults from field 12 of /proc/self/stat. Costs: 34 µs per major fault, range 30-37 across three runs. In a separate experiment, counting faults during forced GC cycles, the first cycle over a pointer-heavy heap - a hand-written struct, not the real generated types, but pointers all the same - produced tens of thousands of faults and took 1345 ms. In comparison, when the same heap fit in RAM, it took 57-83 ms.
So we are trading memory for disk I/O or CPU, depending on the backend. With file-backed swap, which is what I measured, the currency is latency: the process blocks waiting for I/O, while the CPU is free. With zram there’s no waiting, but every page costs a compression and then a decompression, so the currency is CPU.
And there’s another problem: this pod actually runs two processes, not one. This means we have to deal with how linux reclaims pages. Linux uses the LRU (and MGLRU) algorithm to reclaim pages. So the least recently used page is the one reclaimed - not the least used one. A page read a thousand times ten minutes ago goes out before a page read once just now. Now consider a page that was just touched. It goes to the head of the list, and reclaim takes from the tail. This page is safe, and the pages that get evicted are the ones nobody touched for a while. This is a problem, and at the application side we do not have any control over this. The process that is bursting is touching its pages all the time, so they stay at the head. The other process is idle, so its pages are at the tail, which makes the kernel prefer reclaiming memory from the idle process to give room to the one that is growing.
The sad part is: the GC will read, but it will not collect, because those pages are alive. So we have a loop: cgroup pressured, kernel forces swap. GC runs, reads all scan pages. Major faults bring those pages back to memory. Bringing them back to memory forces the kernel to evict other pages. GC finishes its job. Since everything was alive, it doesn’t reclaim anything. Pressure continues, start again.
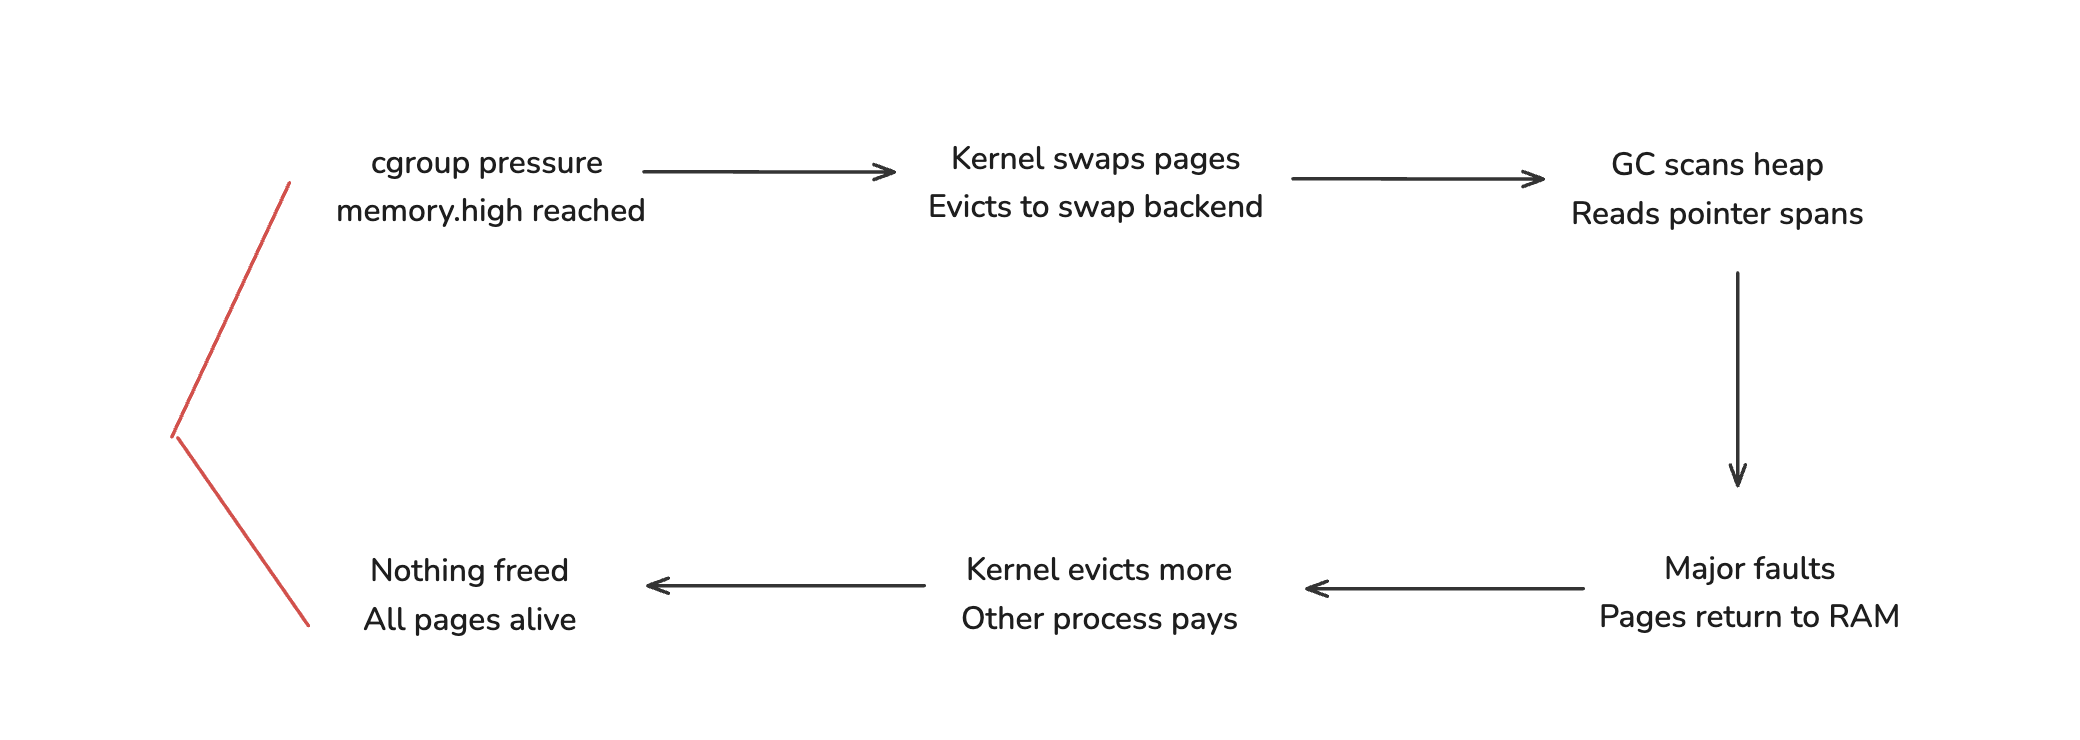
That’s disappointing. I was hoping to fix this issue with swapping. Go’s collector reaches every object that holds pointers because that’s how it determines what’s alive. It does not matter if the application has not used those objects for a long time, the collector will read them anyway. So the set of pages the collector touches and the set the application touches are not the same. The idea of letting the kernel push the cold pages out to swap does not work in a language with a tracing garbage collector.