1193 backends waiting on an append
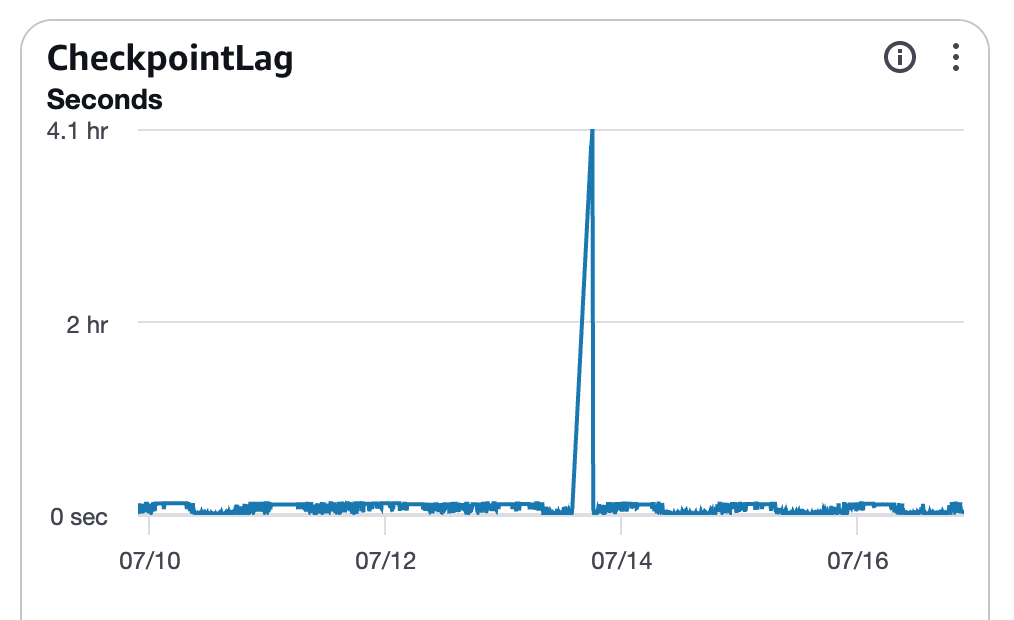
We got another Postgres IO incident this week, but this time IORead wasn’t the bottleneck. The instance was an AWS RDS on gp3 with 12k provisioned IOPS, and after a few hours EBSIOBalance slowly dropped to 0%.
During peak: 9k IOWrite, 6k connections (200 is the baseline), checkpointlag spiked to 4 hours.
At the same time, we hit the antiwraparound threshold of 200M and autovacuum was triggered, starting the scan of 237 databases (yes, the databa model in this one is interesting - this instance has 10k+ databases).
wait_event_type |     wait_event      | count
-----------------+---------------------+-------
 LWLock          | WALWrite            |  1193
 IO              | DataFileRead        |   194
 LWLock          | pg_stat_statements  |    23
                 |                     |    23
 IPC             | CheckpointStart     |    14
 IPC             | BufferIo            |     8
 Lock            | transactionid       |     4
 IO              | DataFileWrite       |     4
 Client          | ClientRead          |     3
 Lock            | frozenid            |     2
 IO              | WalSync             |     1
 IO              | DataFileExtend      |     1
 IO              | SlruRead            |     1
 IPC             | CheckpointDone      |     1
1193 LWLock on WALWrite surprised me. This database doesn’t receive many writes. Most of the load is doing scans on big tables, so at first I thought: Oh, ok, another bad monday because of sequential scans. But that wasn’t it.
Why are backend processes being locked behind a simple wal write?
My first guess, before I looked at pg_stats, was the autovacuum. But look at that: only two processes locked on frozenid. That wasn’t it. DataFileRead also surprised me: 194 against 1193 WALWrite locks. This is basically six to one.
Another thing: WALWrite is not an IO wait, it’s a lock event. Processes were waiting on each other.
I remember I thought: but why? Appending to WAL is not an expensive operation. A WAL record is small, and writing to it is an append. Well, today, a few days after the incident, I had the chance to dig deeper by reading xlog.c in the source code. The mental model after this: we have two paths the insert side and the flush side.
The first thing I found was the insert side.
* Inserting to WAL is protected by a small fixed number of WAL insertion
* locks. To insert to the WAL, you must hold one of the locks - it doesn't
* matter which one.
We have 8 NUM_XLOGINSERT_LOCKS. The insert itself is two steps:
* 1. Reserve the right amount of space from the WAL. The current head of
*    reserved space is kept in Insert->CurrBytePos, and is protected by
*    insertpos_lck.
*
* 2. Copy the record to the reserved WAL space. This involves finding the
*    correct WAL buffer containing the reserved space, and copying the
*    record in place. This can be done concurrently in multiple processes.
Step 1 is serialized, and they say so in ReserveXLogInsertLocation:
* This is the performance critical part of XLogInsert that must be serialized
* across backends. The rest can happen mostly in parallel. Try to keep this
* section as short as possible, insertpos_lck can be heavily contended on a
* busy system.
But look at what it does under that spinlock:
SpinLockAcquire(&Insert->insertpos_lck);

startbytepos = Insert->CurrBytePos;
endbytepos = startbytepos + size;
prevbytepos = Insert->PrevBytePos;
Insert->CurrBytePos = endbytepos;
Insert->PrevBytePos = startbytepos;

SpinLockRelease(&Insert->insertpos_lck);
That’s only three reads and two writes. Not that much work. If this was the problem, I would’ve seen LWLock:WALInsertLock. But I didn’t.
The flush path is more interesting:
* WALWriteLock: must be held to write WAL buffers to disk (XLogWrite or
* XLogFlush).
(...)
* info_lck is only held long enough to read/update the protected variables,
* so it's a plain spinlock. The other locks are held longer (potentially
* over I/O operations), so we use LWLocks for them.
So flush is 1 lock, exclusive. Very different from the 8 locks of the insert path. Since there’s only one WAL stream and one device, this is where successful inserts fall into. It makes sense.
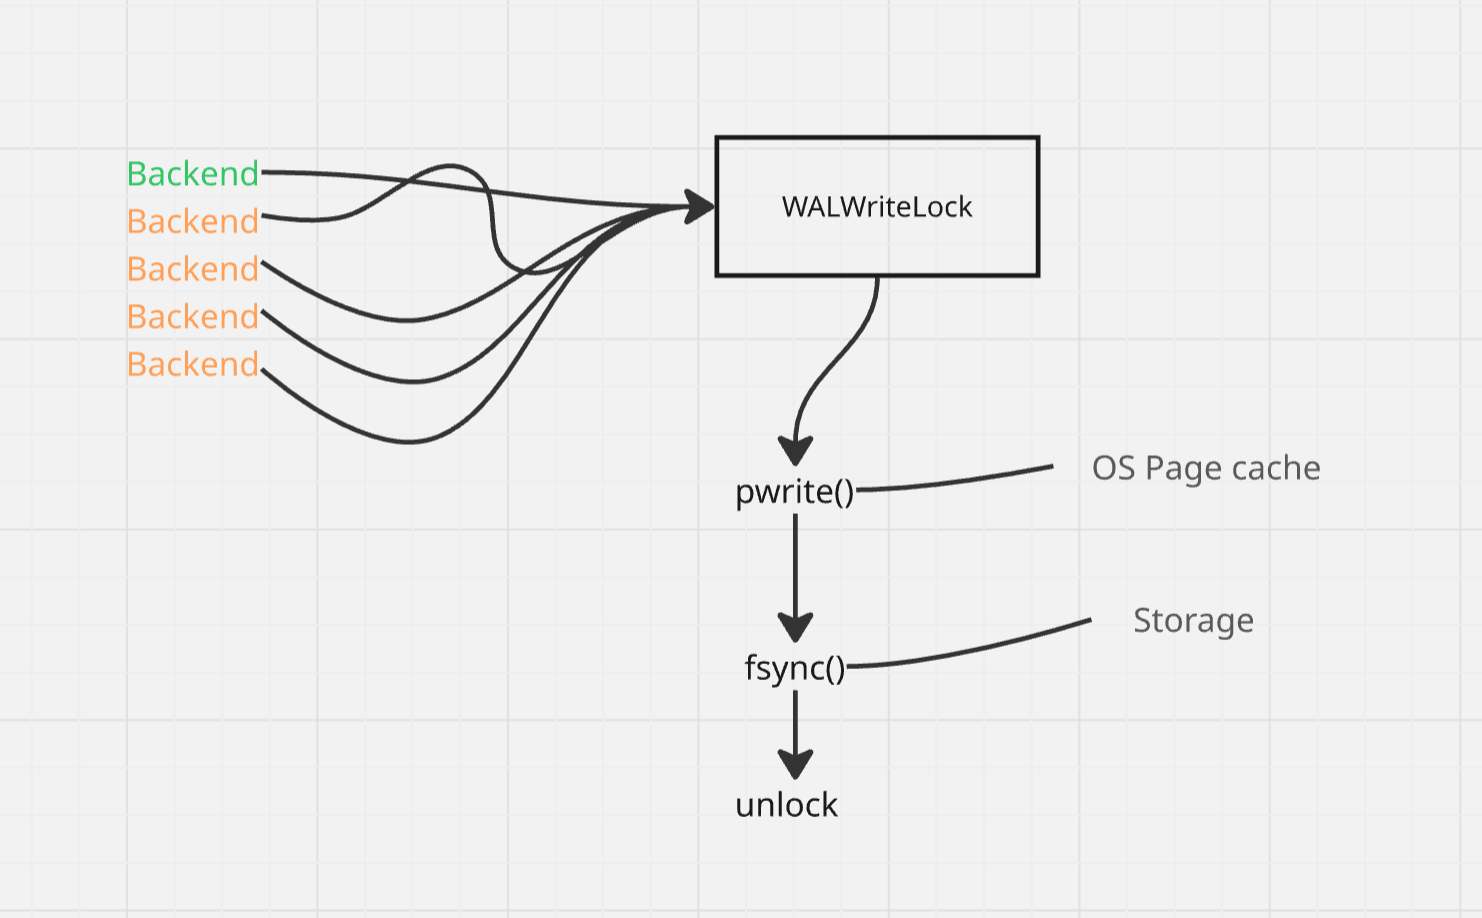
XLogWrite does a pg_pwrite under that lock. pwrite is somewhat cheap since it doesn’t persist to disk, but is satisfied once it hits the OS page cache. After that, we get fsync - issue_xlog_fsync, which goes through the block layer, the driver, across the EBS network. So everything is memory except the fsync step. This also makes sense.
Out of all those 1193 backends, only one backend was doing something, the other ones are waiting on a futex - D state processes.
The EBSIOBalance dropping to 0% doesn’t signal anything to the kernel because there were no errors - things were waiting on a lock, that’s it. Once EBSIOBalance reached zero, requests beyond the baseline were effectively throttled, increasing fsync latency. From the kernel’s point of view the device got slower, and the fsync inside the critical section takes longer, the lock is held longer, and 1193 backends wait longer for the lock.
Compare it to the IO:DataFileRead, which is a classical wait event. We had 194 backends issuing a pread, each waiting on their own IO. Service time is distributed since there’s no lock between one request and the other - no serialization as well. DataFileRead scales with outstanding IO requests, and WALWrite scales with how long one backend holds the flush lock.
There are things I still don’t know: I don’t know how much the freeze influenced IO exhaustion since AWS EBSIOBalance is an instance-level number it counts everything: vacuum reads, query reads, checkpoint writes, WAL. Peak was 9k and most writes, which points away from the vacuum reads. But the vacuum was writing too since it generates WAL.
I also don’t have a fsync number because I didn’t check pg_stat_wal during the incident, which is annoying. 1193 is a product, not a measurement number. Little’s Law tells us queue length is arrival rate * waiting time. So: 5000 commits/s with a 1ms fsync gives us 5 backends parked on that lock, permanently, and it means group commit is working - backends don’t fsync independently because to fsync “200” you need to fsync everything before it that wasn’t fsync’ed before. The same 5000 commits/s with a 240ms latency gives us 1200. Both are “1193 backends on WALWrite”. The count alone can’t tell them apart because it collapses arrival rate and service time into one number. ms_per_sync is the factor I needed but sadly didn’t sample.
I learned a lot. LWLock:WALWrite is not really “oh boy, there are lots of wal writes right now”. It represents something more threatening: there’s a lock, something is holding that lock, everyone else who is waiting on the line is sleeping. There’s only one flush path, and there’s nothing we can do if one of them is taking too long. This is threatening because of how fast service time scales up and the queue fills. What happened is a clear example of this: we had one bottleneck, and look at what happened: 6k connections, 4 hours of checkpointlag, 1200 backends waiting on a lock.